Logit and Probit models are both types of regression models commonly used in statistical analysis, particularly in the field of binary classification. This means that the outcome of interest can only take on two possible values / classes. In most cases, these models are used to predict whether or not something will happen in form of binary outcome. For example, a bank might want to know if a particular borrower might default on loan or otherwise. In this blog post, we will explain what logit and probit models are, and we will provide examples of how they can be used. As data scientists, it is important to understand the concepts and differences between logit and probit model, along with the examples of real-world scenario where they can be used.
What is a Logit Model?
Logit model is a form of a regression model that is used to fit a categorical dependent variable and predict the probability of an event occurring. Logit model is also called logistic regression model. The logit model is based on the logistic function (also called the sigmoid function), which is used to model situations where there are two / binary possible outcomes or categorical outcomes. That said, logit models can also be generalized to dependent categorical variable which can have more than two possible outcomes. The logit function produces an output on a continuous scale that ranges from 0 to 1.
Logit models generally take one of two forms: multinomial logits and binary logits.
- Multinomial logits predict a value from multiple mutually exclusive outcomes
- Binary logits predict either a 1 or 0 outcome from a single variable.
- In both cases, the model takes into account independent variables that may influence the outcome, such as borrower’s credit score, income, debt-to-income ratio, loan amount, etc when predicting whether borrower would default on loan. The model then produces an estimated probability which is compared against a predetermined threshold to determine if the predicted outcome is correct or not.
Logit Model Formula
The logit model is used to model the odds of success of an event as a function of independent variables. The following formula represents the starting point of arriving at the logistic function which is used to model the probability of occurrence of an event.
A logit function can be written as follows:
logit(I) = log[P/(1-P)] = Z = b0 + b1X1 + b2X2 + ….. + bnXn
where P is the probability of an event occurring, and l is the odds of an event occurring. Z is the linear combination of independent variables with coefficients. The above equation can be solved further to arrive at the following function which can be used to determine the probability of occurrence of the events.
$$ P = \sigma(z) = \frac{1}{1 + e^{-Z}} $$
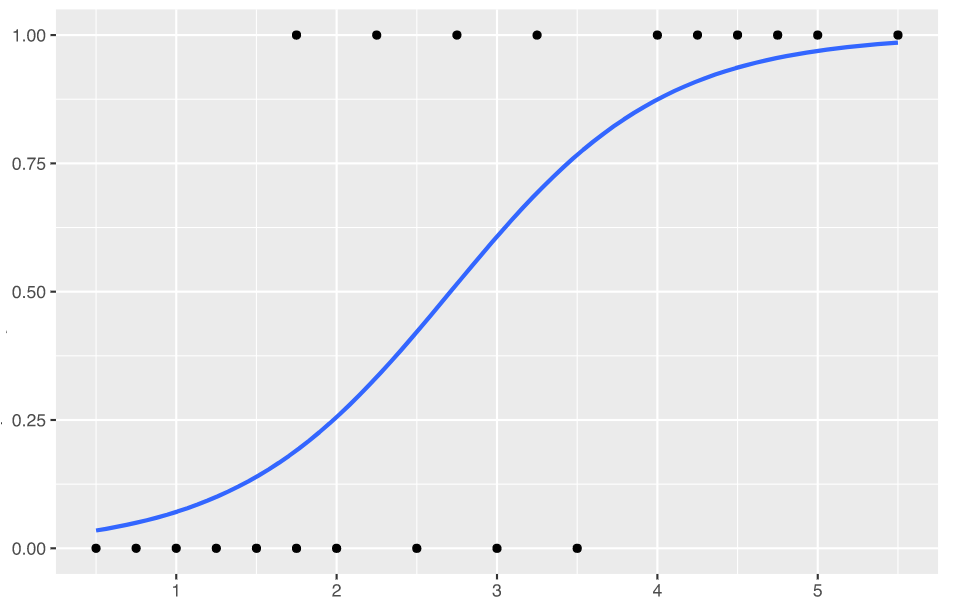
The above formula represents the probability of outcome and will take the value between 0 and 1. This formula can also be termed as probability distribution function for modeling the probability of an outcome. This can also be called as the logit model. It is the cumulative distribution function of the logistic distribution. The logistic distribution is a continuous probability distribution and is characterized by its S-shaped curve, known as the logistic function as shown below. Logit models produces S-shaped curve.
The σ(Z) is also called a logistic or sigmoid function. As the value of Z approaches -infinity, the value of σ(Z) or P approaches 0. And, as the value of Z approaches +infinity, the value of σ(Z) or P approaches 1.
What is a Probit Model?
Probit model is a form of a statistical model that is used to predict the probability of an event occurring. These models are also termed as Probit regression models. Probit model is similar to logit model, but it is based on the probit function instead of the logistic function. Probit function is also called as probit link function. In probit model, the cumulative distribution function
of standard normal distribution is used to model the relationship between the predictors and the probability of the event occurring. The output of the Probit model also ranges from 0 to 1, like that of the Logit model.
Probit Model Formula
The Probit model formula looks like the following:
Pr(Y = 1|X) = Φ(Z)
Where,
Z = b0 + b1X1 + b2X2 + ….. + bnXn
Where, Y is the dependent variable and represents the probability that the event will occur (hence, Y = 1) given the variables X. Z is the linear combination of independent variables (X) with coefficients (b0, b1, b2…bn). In the case of the logit model, we use logistic or sigmoid function instead of Φ which is cumulative distribution function of standard normal distribution. The parameters (such as b0, b1, etc) are estimated using maximum likelihood estimation technique. This also holds good for logit models.
You may note that the key difference between logit and probit model is the sigmoid or logistic function and cumulative normal distribution function respectively.
Differences between Logit & Probit Models
The primary differences between logit (logistic regression) and probit models lie in their underlying statistical distributions and the consequent impact on the model’s characteristics and interpretations. The following are some of the key differences between the Logit and Probit models:
- Link function: The main difference between Logit and Probit models lies in the choice of the link function used to model the relationship between the predictor variables and the probability of the event occurring. In the case of the logit model, we use a logistic or sigmoid function while in case of probit models, the probit link function Φ used is a cumulative distribution function of the standard normal distribution.
- Shape of the Distribution Curve:
- Logit Model: The logistic distribution has heavier tails than the normal distribution. This means it can handle extreme values in the predictors or outcomes slightly better.
- Probit Model: The normal distribution has lighter tails, implying that the probit model might be less accommodating of outliers compared to the logit model.
- Model Assumptions: Logit and Probit models make different assumptions about the distribution of the error term. Logit models assume that the error term follows a logistic distribution, while Probit models assume that the error term follows a normal distribution.
- Coefficient Interpretation:
- Logit Model: The coefficients in a logit model can be easily interpreted as odds ratios. A one-unit change in a predictor variable changes the odds of the event happening by a factor of the exponentiated coefficient.
- Probit Model: Coefficients represent the change in the Z-score (from the standard normal distribution) for a one-unit change in the predictor. This is less intuitive than odds ratios.
- Usage: The logit model is more widely used than the probit models and has a more extensive literature.
- Outliers: Logit model is also more robust to outliers as it uses a logistic function but Probit model is more sensitive to outliers
- Computational Complexity: Historically, computing the probit model was more complex due to the need for numerical methods to calculate the normal CDF. However, with modern computational resources, this is less of a concern.
- Model Performance: In practical applications, logit and probit models often yield similar results, especially for values not in the extreme tails of the distribution. The choice between them may not significantly affect the model’s performance in many cases.
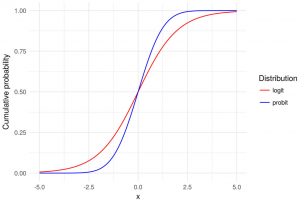
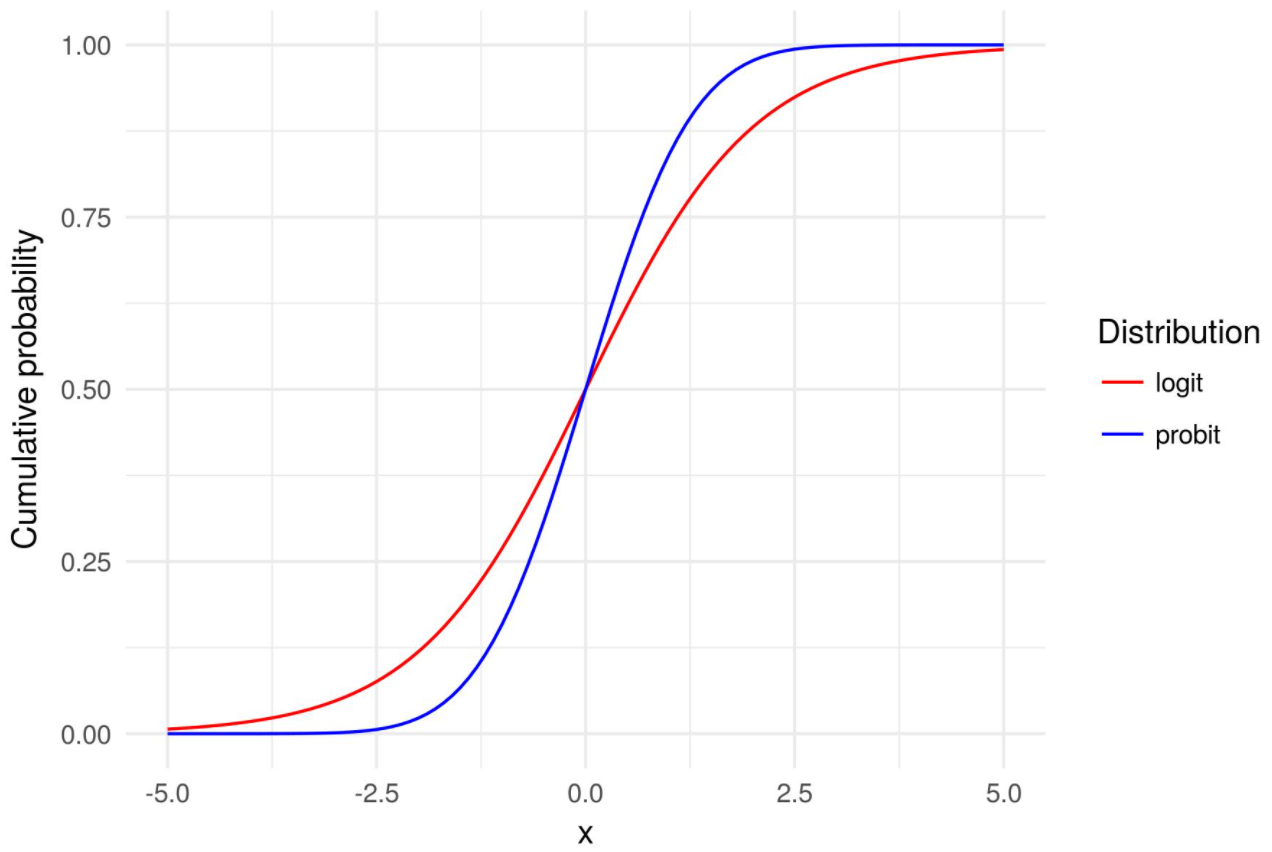
The picture below represents the Logit & Probit models:
Take a Quiz
Results

Check out my latest book titled as First Principles Thinking: Building winning products using first principles thinking. Check out my other blog, Revive-n-Thrive.com
- Logistic Regression in Machine Learning: Python Example - April 26, 2024
- MSE vs RMSE vs MAE vs MAPE vs R-Squared: When to Use? - April 25, 2024
- Gradient Descent in Machine Learning: Python Examples - April 22, 2024


#1. What equation is used to represent a logit model?
#2. What equation is used to represent a probit model?
#3. In which situations should a logit model be used?
#4. What is a logit model?
Check out my latest book titled as First Principles Thinking: Building winning products using first principles thinking. Check out my other blog, Revive-n-Thrive.com
- Logistic Regression in Machine Learning: Python Example - April 26, 2024
- MSE vs RMSE vs MAE vs MAPE vs R-Squared: When to Use? - April 25, 2024
- Gradient Descent in Machine Learning: Python Examples - April 22, 2024
Thanks. This is quite informative. I feel confident that I can use these models in research now.
Thank you!!!!
What a refined concept and understanding!!
Thank you
Thank you
I have got important concept on the the two models.
Thank you for leaving your feedback.
Very helpful explanation. Thank you.